Webserver Logs
The web server logs provide you with an overview of all logged access and error messages that occur when your domains are accessed.
You can access it via the domain overview by clicking on the button:
![]()
The table now shows you the latest log entries.

Columns Meanings
|
Date |
The time of the log entry. |
|
Client IP |
The remote IP that accessed the domain and so caused the log entry. |
|
HTTP code |
The HTTP status code returned to the client. |
|
Message |
The logged message: For example, the name of a requested file or a PHP error message. |
|
Referer |
The website where the request came from. Note: Move the mouse over the (?) to read this information. |
|
User Agent |
Shows the program used to access the domain. Note: Move the mouse over the (?) to read this information. |
|
Protocol |
The log file in which this log entry was found. |
A click on this button reloads the log files and updates the table:
![]()
Realtime monitoring reloads the log files at regular intervals and updates the table until you close the page or stop realtime monitoring.

Use the following checkboxes to filter the output in the table. Only entries of the log file whose checkbox has been selected are displayed.
![]()
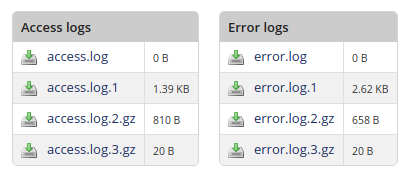
You can download the complete log or the previous log files in the lower part of the page.
Click on the name of the protocol file you want to download.

Article Number: 92
Posted: Wed, Oct 25, 2017 - 12:07 PM
Last Updated: Wed, Dec 13, 2017 - 12:21 PM
Online URL: https://kb.keyhelp.de/article/webserver-logs-92.html